The world.
In perspective.
Every market story starts somewhere. Place the event. See the geography behind the headline.
Scroll to change perspective Traid
Turn a market question into a testable idea. Bring charts, news, geographic context and quantitative studies into one workspace. Examine the bullish, bearish and neutral case. Then put the numbers to work.
{
  "fast": 20,
  "slow": 50,
  "capital": 10000,
  "costBps": 10
}Every market story starts somewhere. Place the event. See the geography behind the headline.
Scroll to change perspectiveA policy decision. A corporate announcement. A question that crosses borders. Explore the wider context before drawing a conclusion.
Explore the locations of selected historical announcements.
Return to the original statement, its date and the question it raises. Keep interpretation close to evidence.
Explore Global in Terminal ↗Illustrative candles use generated OHLC shapes. Explore selected events from the 2023 archive. Geography: Natural Earth.
Your question. Your data. Your research desk. Arrange charts, Global, news and chat side by side. Keep a source close in a floating window as you investigate.
Your research desk, in the browserFollow the news, examine the numbers and keep a paper-trading record within reach. Explore historical policy decisions in Global.
Coming soon on iPhoneExploring a connection between market research and everyday finance; a magnetic wallet and payment card.
Coming soon · In developmentPrice tells one part of the story. Explore the evidence behind the move. Bring market context, risk and strategy into the same line of sight; move from a broad question to the calculation that matters.
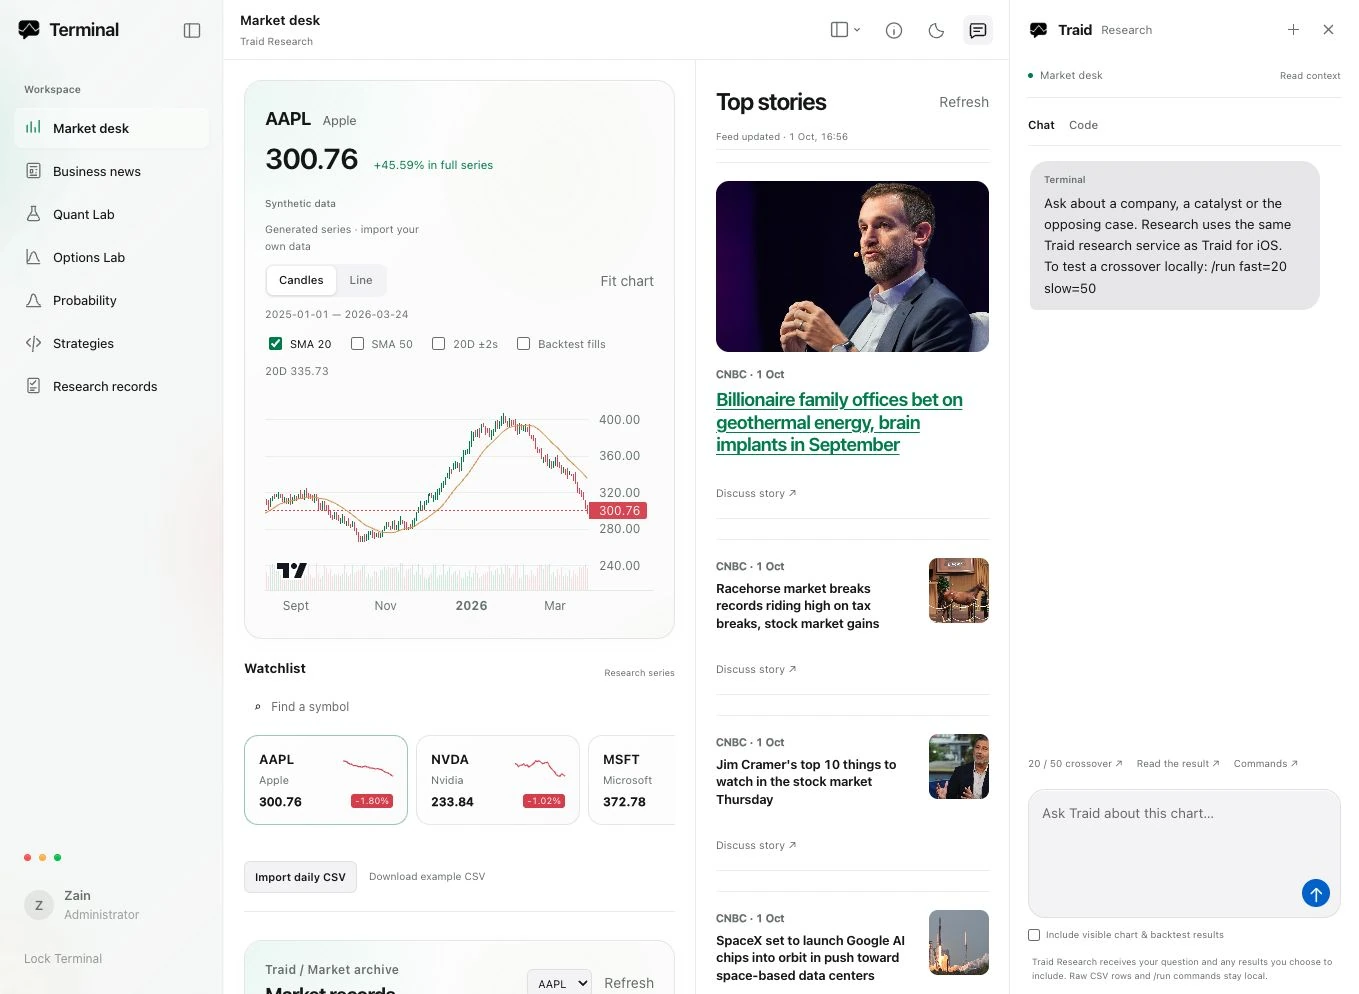
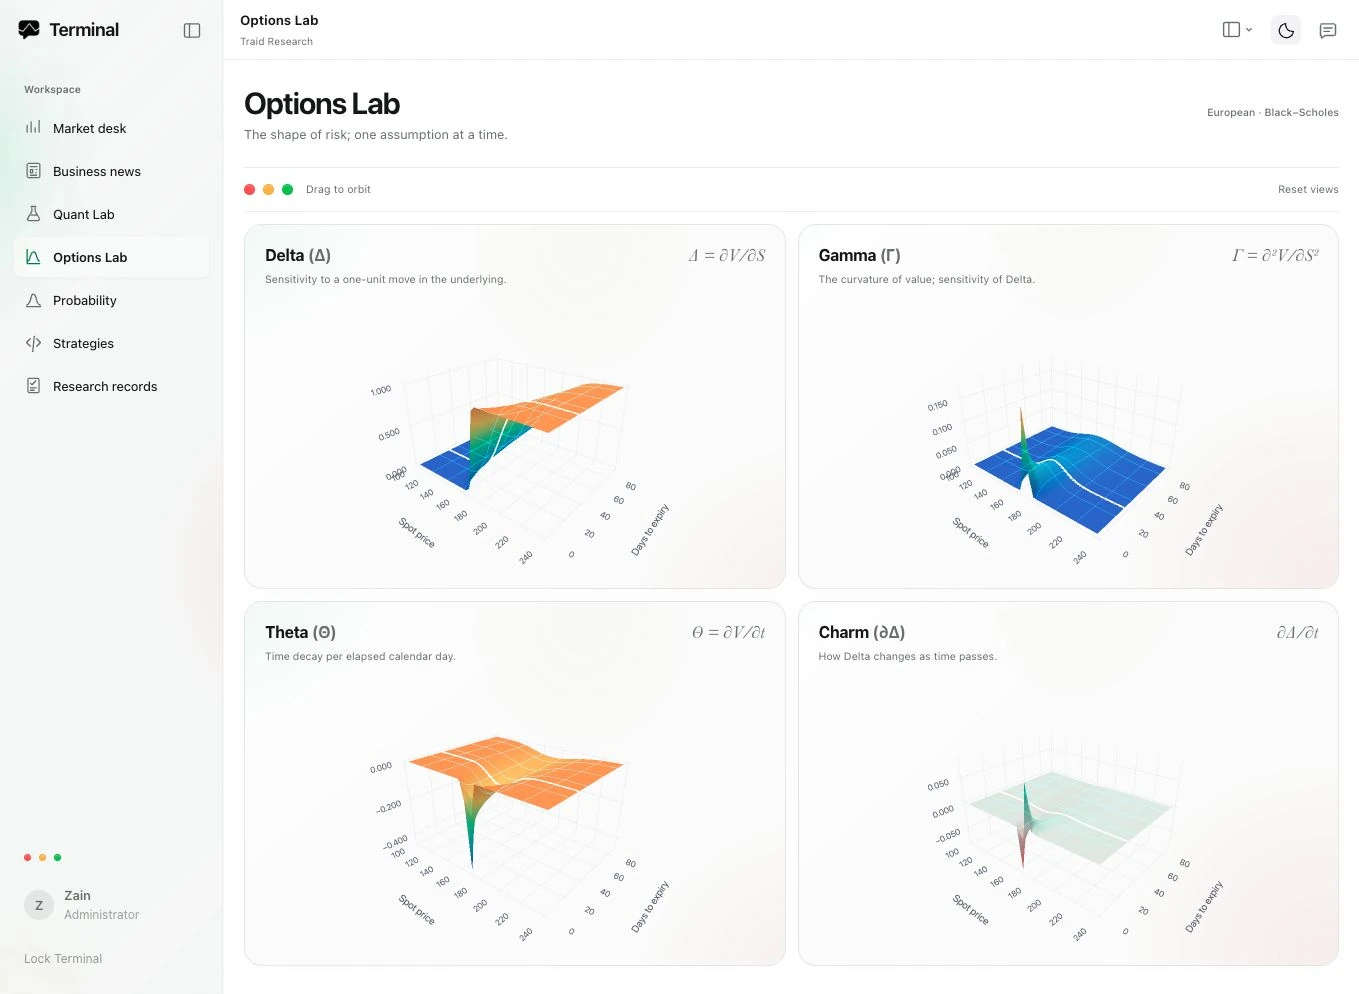
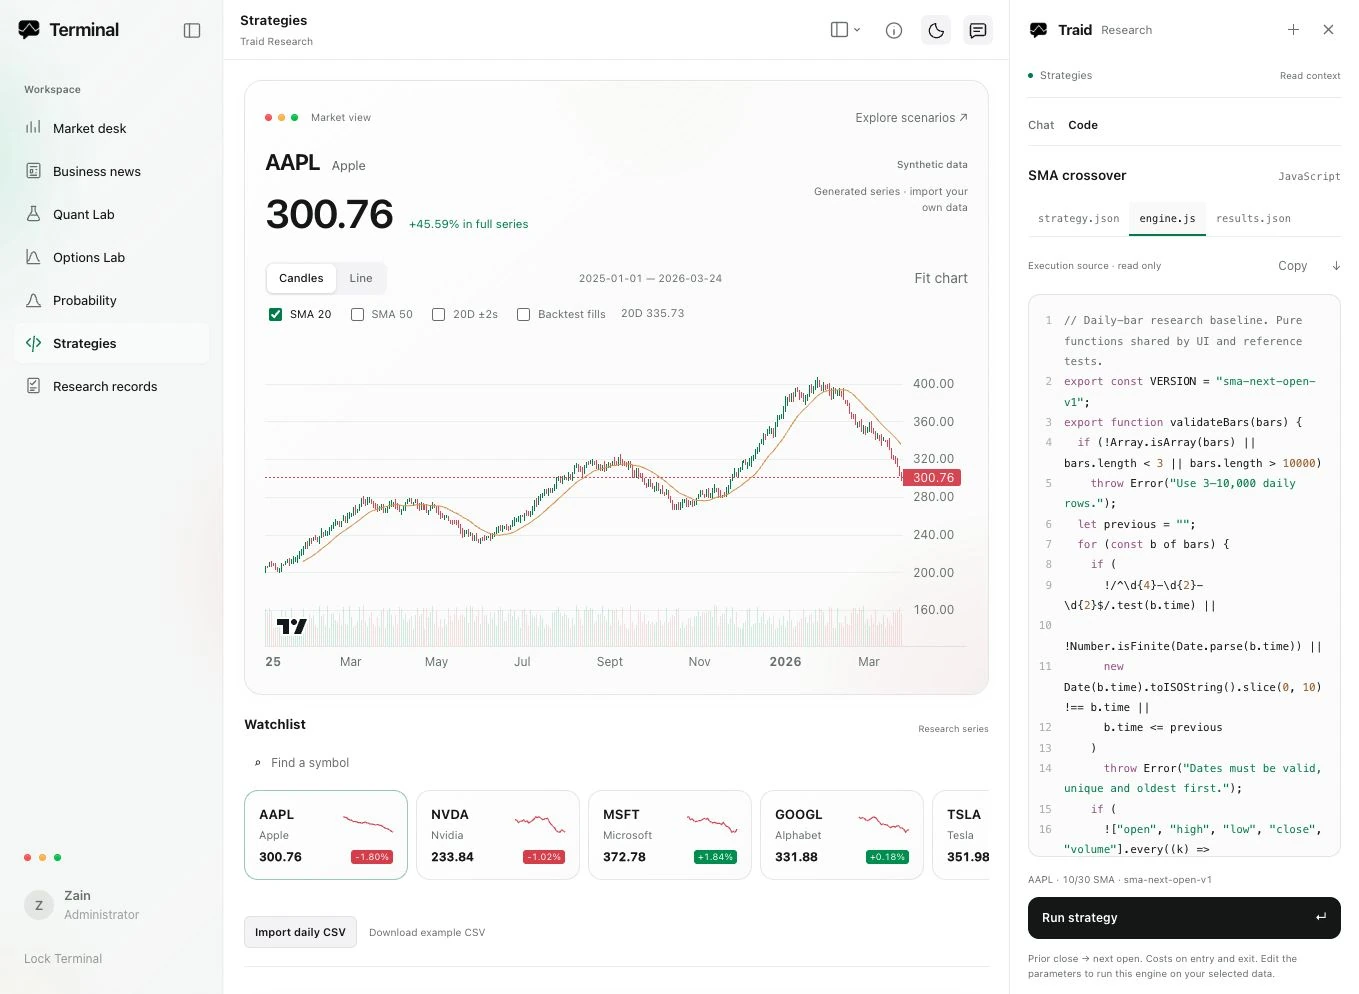
Follow a headline into the chart. Examine how risk changes across price and time. Read the calculation behind a result before making it part of your thesis.
Put price action in context with source-linked news and a research conversation. Explore the chart, question the explanation and follow the evidence.
Workspace previews use synthetic research candles and dated Federal Reserve H.10 currency observations. Import daily data to investigate your own market.
Explore the case for, the case against, and what sits between. Then follow the evidence.

Find the catalyst. Make the positive case explicit, with assumptions you can test.
Separate an observation from its explanation. Leave room for uncertainty.
Seek the counterargument. Define what would invalidate the idea before testing it.
Read the headline. Challenge the explanation. Turn a market observation into a question you can test; keep the assumptions and evidence with the result.
Traid’s news feed supplies article imagery, source links and dated market metrics. Keep charts and news side by side; send a headline to the research conversation.
Open business news ↗Import daily OHLCV and define the moving-average study. Inspect parameters, execution logic and results; make each assumption available for scrutiny.
Open the strategy workspace ↗Compare returns, drawdowns and every fill. Save a study with its data, assumptions and calculation version. Reopen it, reproduce the result and trace the numbers back to their inputs.
Read the evaluation note ↗A useful result comes with a record. Traid keeps data, parameters, execution assumptions and calculation versions together so a study can be examined and reproduced.
Import daily OHLCV with its source, currency and adjustment convention. Review ordering, duplicates and quality flags before running the study.
Inspect volatility, Sharpe, drawdown duration, exposure and turnover. Use paired uncertainty intervals to compare the strategy with its benchmark over the same evaluation window.
Save a study to your private account. Dataset fingerprints and separately verified calculations connect the result to the exact inputs that produced it.
Bring information, market context and the path of risk into one research process. Turn an observation into a defined study, then build on what each result teaches you.
at = f(It)
Anchor each decision to the information available at that moment. Connect observations, publication times and confirmed signals in a clear sequence.
I is the information available at time t; a is the decision made from it.
μ(s) = E[rnet | s]
Explore how a pattern behaves across trends, volatility and trading sessions. Define the context, compare related conditions and map the consistency of results.
s is the market state at the decision; r is return after costs; μ is its conditional expectation.
Bt = Et − Lt
Follow equity, drawdown and account boundaries through time. For accounts with a defined loss floor, measure the distance to that boundary at each observation.
E is equity; L is the applicable loss floor; B measures their distance at time t.
Our design principle: deterministic calculations produce the evidence; AI helps interrogate it. Keep the data, assumptions and calculation version with each result, so an explanation can be checked against the record.
Turn every study into a foundation for the next.
Change an assumption and measure its effect. Explore volatility, dependence and uncertainty through the equations that define them; trace each study to its method and source literature.
See the sensitivity.
Question the peak.
How quickly does Delta change? Read the curvature across price and time to expiry.
European Black–Scholes · K = 100 · σ = 25% · r = q = 0
Illustrative inputs · Gamma per unit of spot
Does the result survive a different window? Compare the surrounding terrain before trusting a peak.
Synthetic daily series · 10 bp per side · annualised Sharpe
Illustrative parameter study · synthetic data
Return is only one coordinate. Put it beside volatility and drawdown to see how the picture changes.
Six synthetic daily series · 20/50 moving-average study
10 bp per side · bubble area represents drawdown magnitude
Annualised RMS log returns, a rolling window and the return distribution. Distinguish realised variation from an implied volatility quote.
Lookback return and standardised deviation; two descriptions of price behaviour, each with a different hypothesis to test.
Estimate a hedge relationship and inspect the residual spread. Explore correlation, spread behaviour and the assumptions behind a statistical-arbitrage study.
European Black–Scholes sensitivities across spot and expiry. Rotate the surfaces; examine Delta, Gamma, Theta and Charm under explicit inputs.
Conditional price distributions, tail probabilities, Bayesian updates and a return/risk bubble map. Model assumptions stay beside the result.
A ridge-regression baseline with a chronological holdout, alongside a strategy parameter surface. Inspect predictive error and selection sensitivity before adding complexity.
Five past log returns become features; the following return is the target. A ridge model learns on earlier observations, then faces a later period it did not fit. The comparison is with a constant training-mean forecast.
Fixed λ = 1 · deterministic synthetic daily series. Compare the fitted model with a training-mean baseline on a later evaluation period.
Inspect the model in Terminal ↗The diagonal marks perfect agreement. A narrow horizontal cloud shows how strongly this regularised model shrinks its forecasts toward the mean.
Put timing, turnover and drawdown beside the idea. Traid’s daily crossover study makes the execution assumptions explicit; signals use earlier closes, fills occur at the next open, and costs apply on both sides.
Timing, price and costs belong in the same picture. Follow a simulated fill through to its retained outcome.
| Component | Assumption |
|---|---|
| Input | One daily series; time, open, high, low, close and volume. Dates must be unique and ordered. |
| Signal | Fast SMA above slow SMA; only closes available before the execution bar enter the signal. |
| Execution | Next open. Fractional units, no leverage; costs on both entry and exit. Remaining positions close at the final bar. |
| Benchmark | Buy and hold with the same warm-up, initial capital and transaction-cost rate. |
| Output | Equity, drawdown, Sharpe, completed trades and costs; export includes engine version and SHA-256 dataset fingerprint. |
Start with a labelled example or import daily data with its source and adjustment convention. Imports are calculated locally; saving a research record stores the selected inputs in your private account. Review the execution and data assumptions alongside each result.
{
  "fast": 20,
  "slow": 50,
  "capital": 10000,
  "costBps": 10
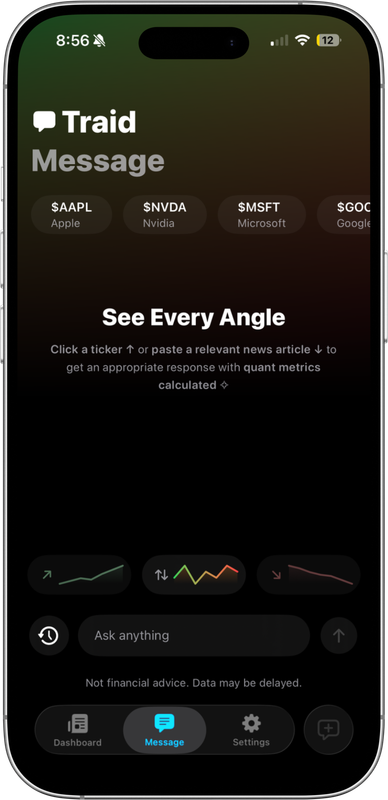
}Follow a market story, examine the numbers and challenge the thesis; wherever your day takes you.
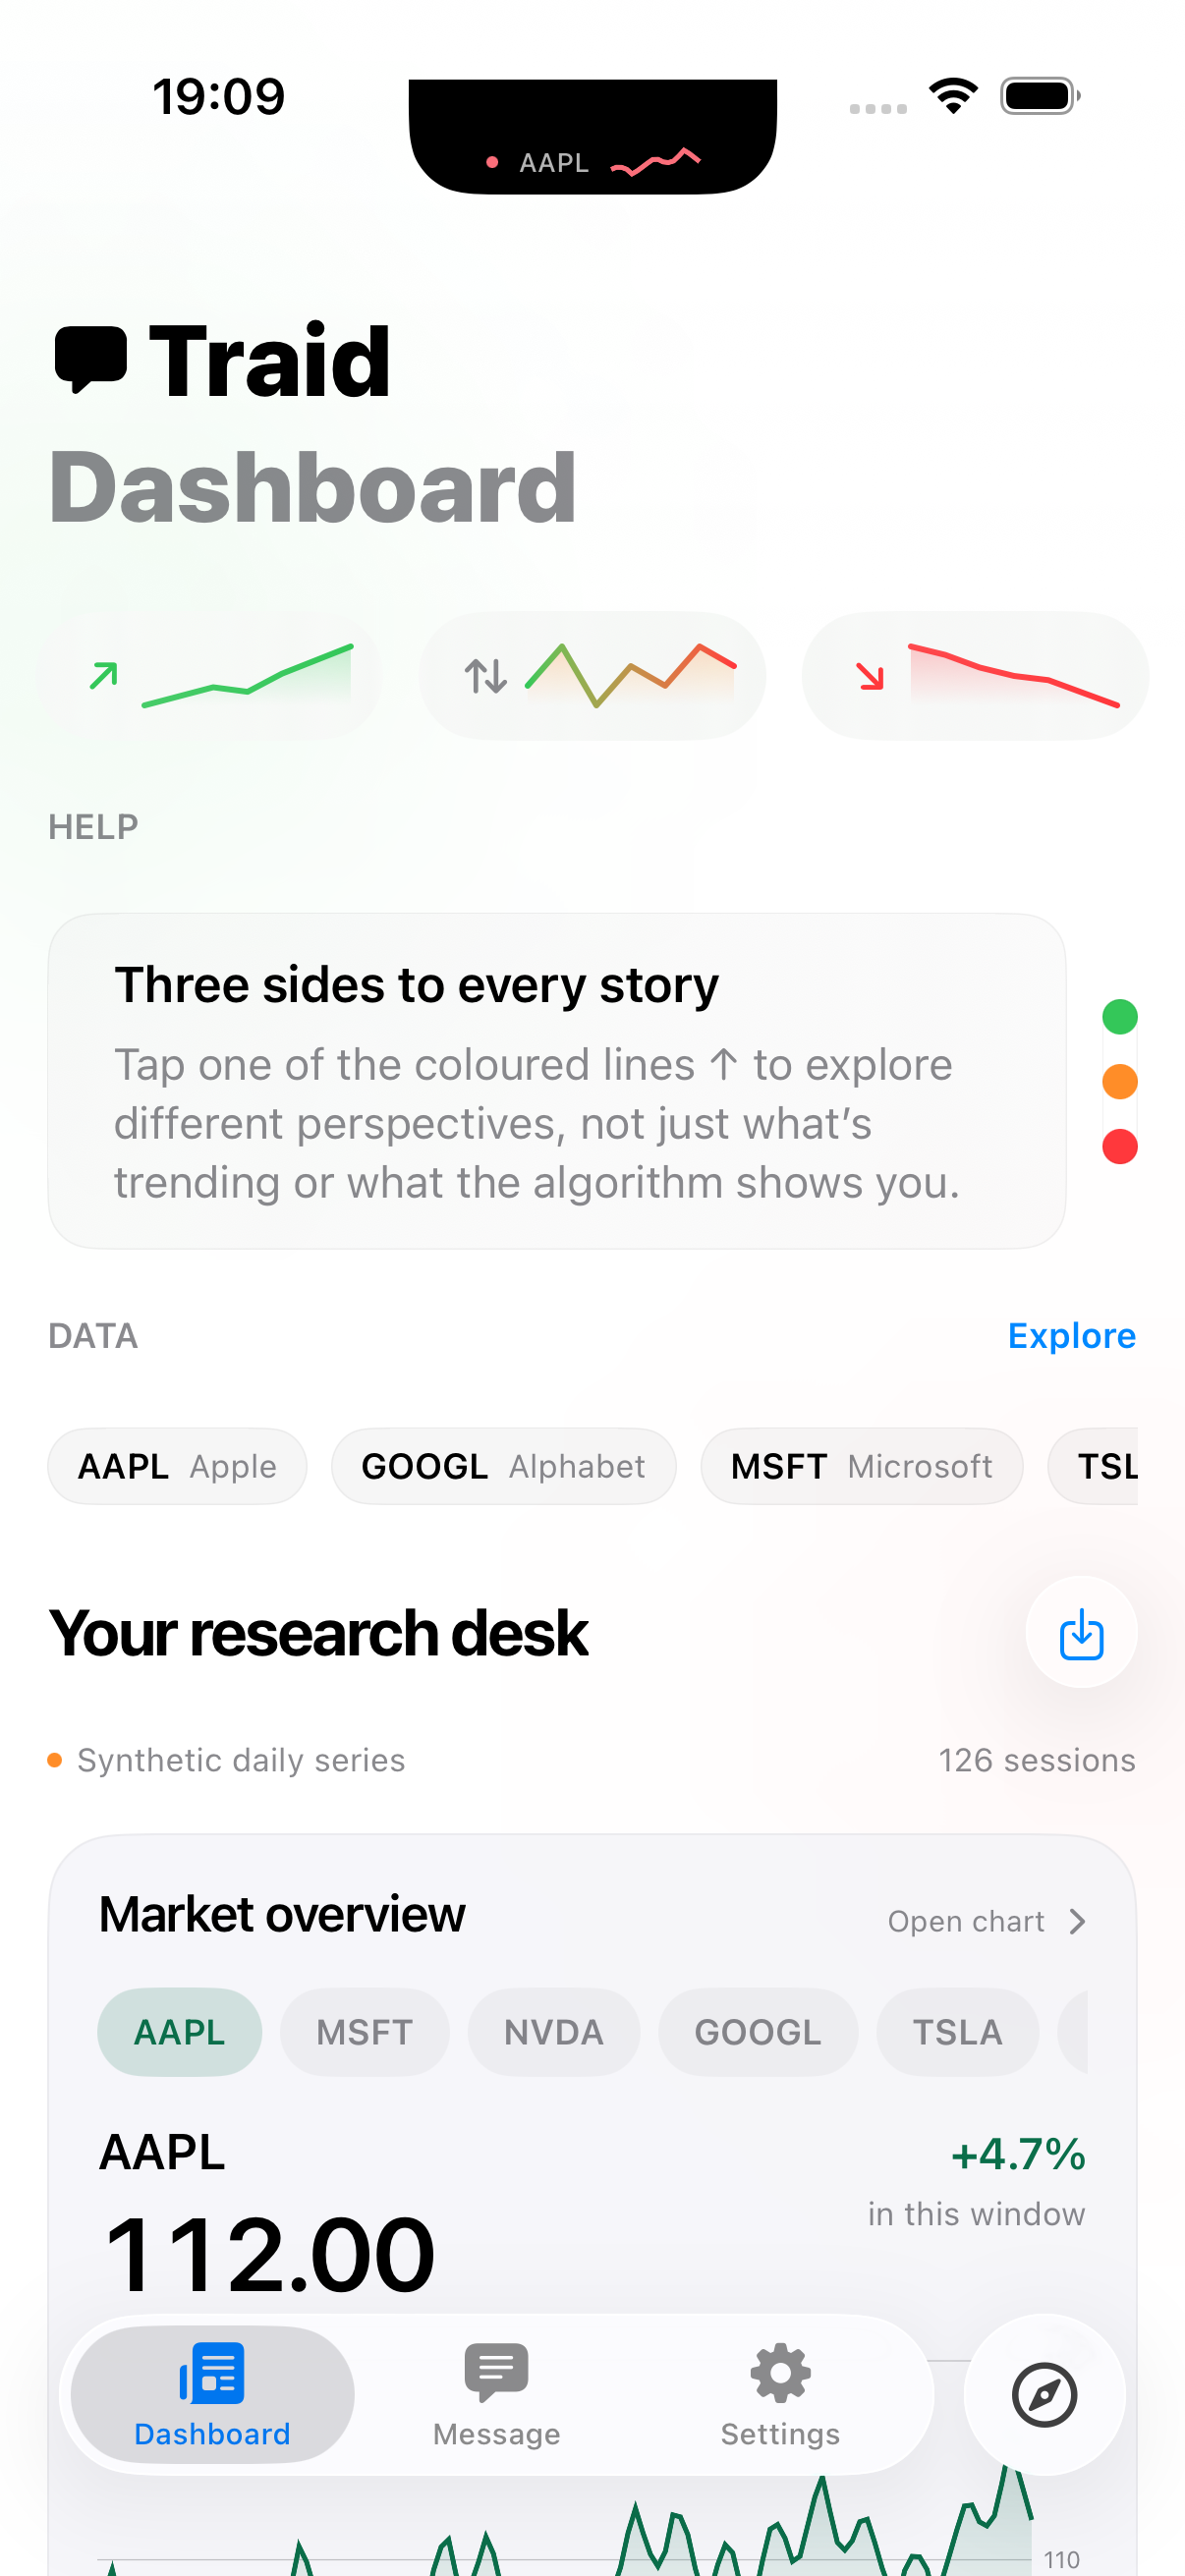
A research notebook. An options lab. A wider view. Follow the story, inspect the mathematics and question the evidence behind a possible edge — wherever the question finds you.

Follow your instruments and weigh opposing perspectives on the stories moving markets.
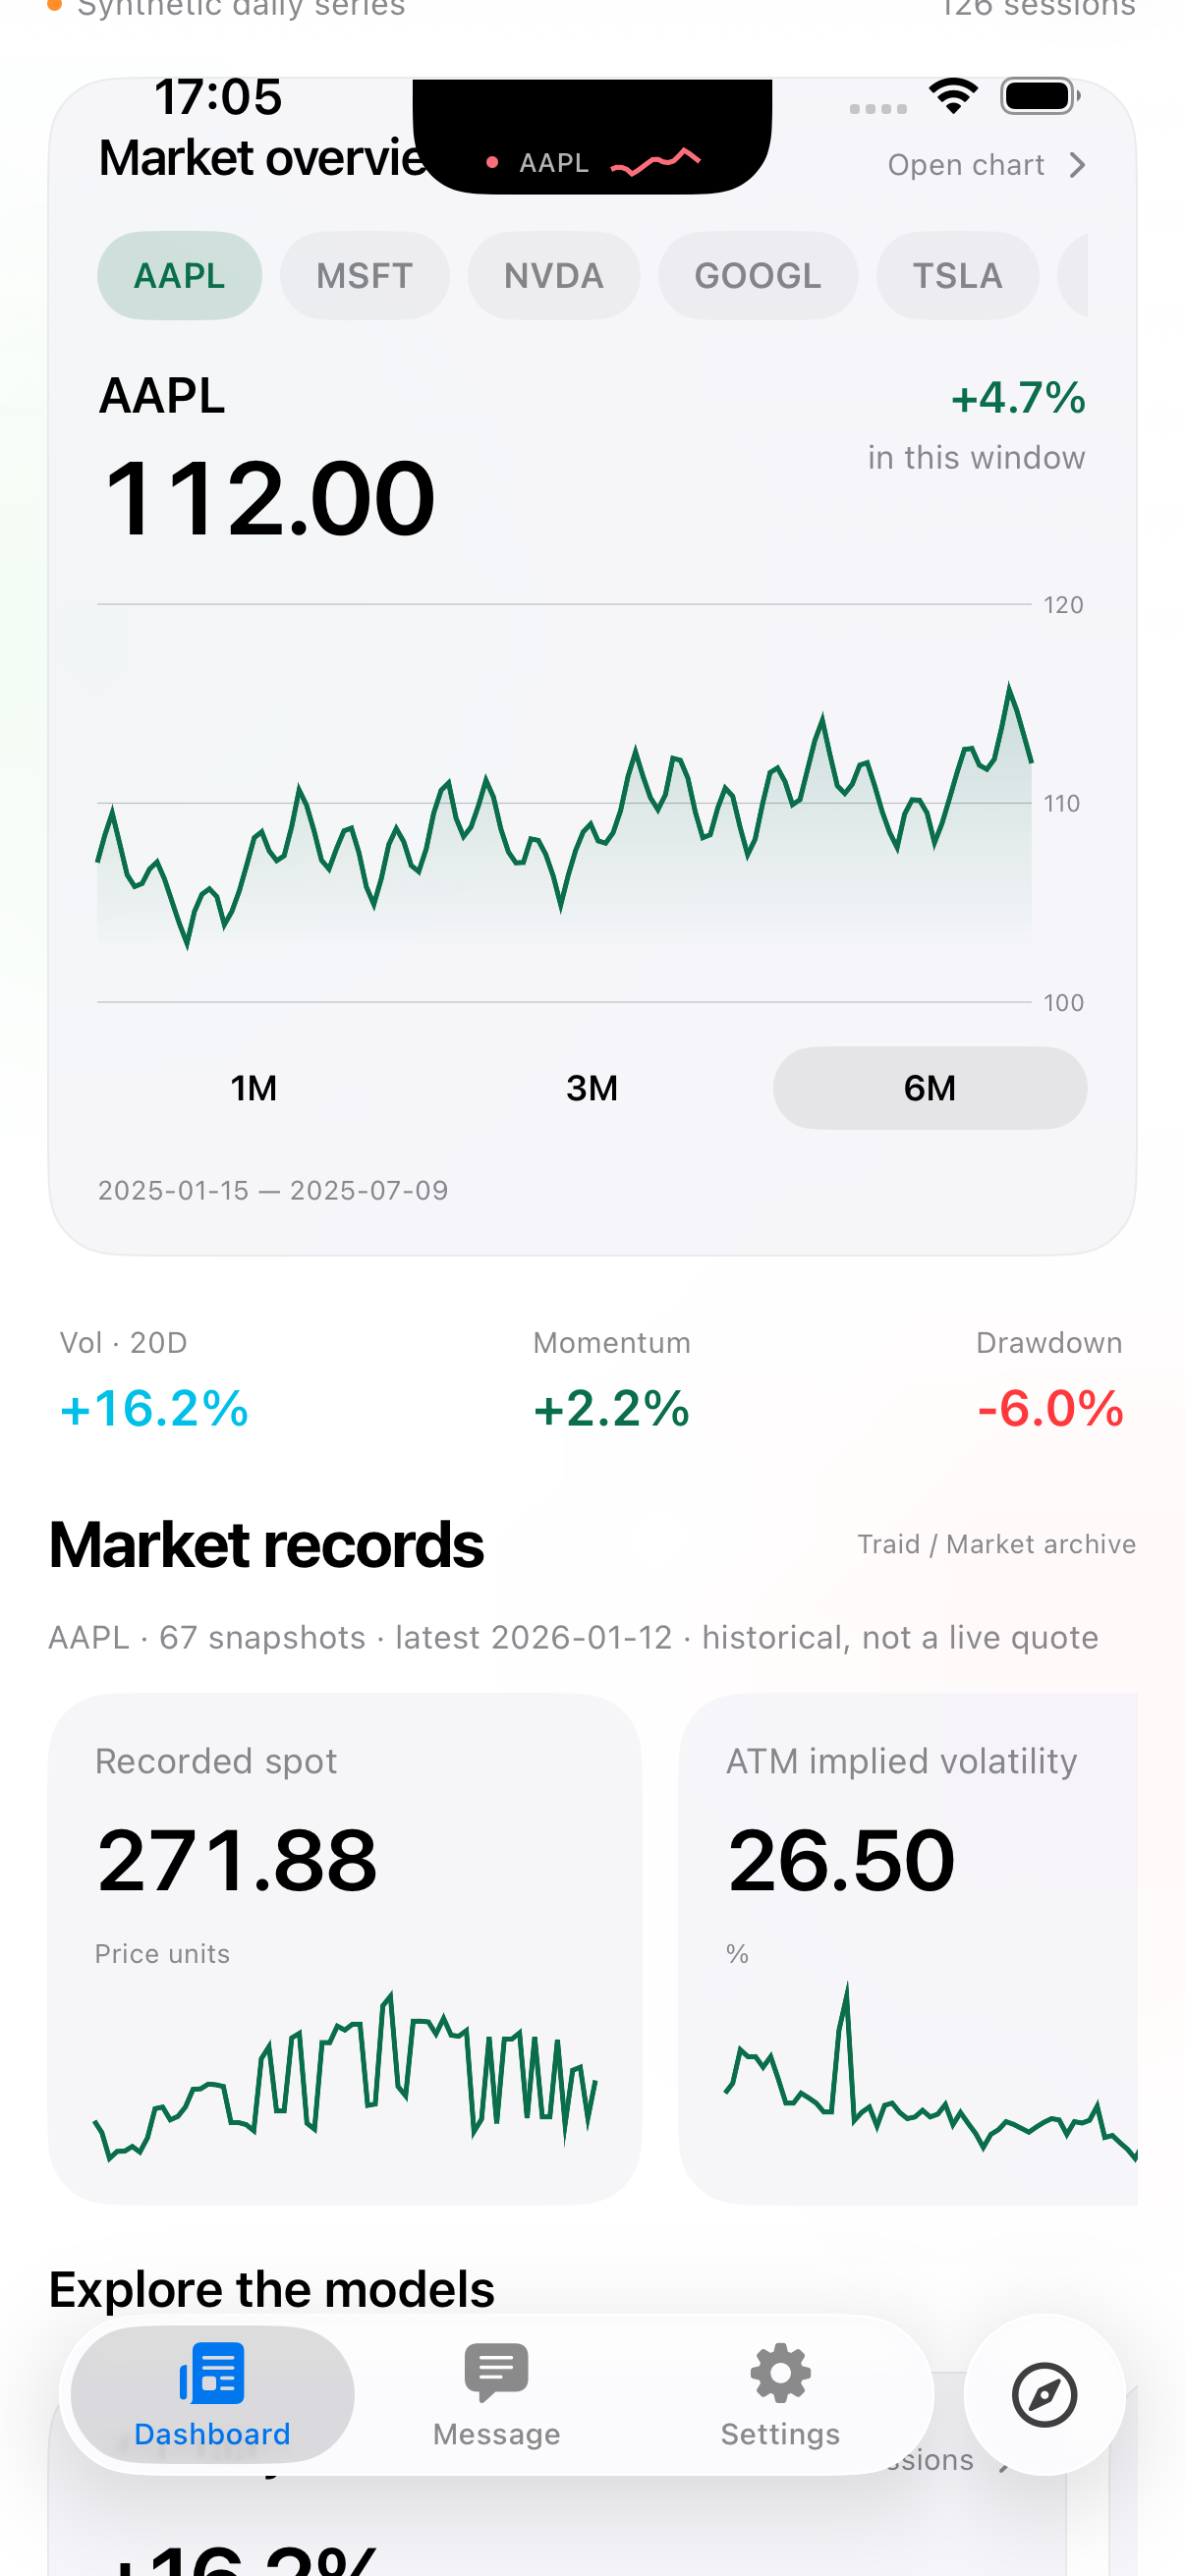
Examine dated market observations; connect price and implied volatility to the record behind each value.
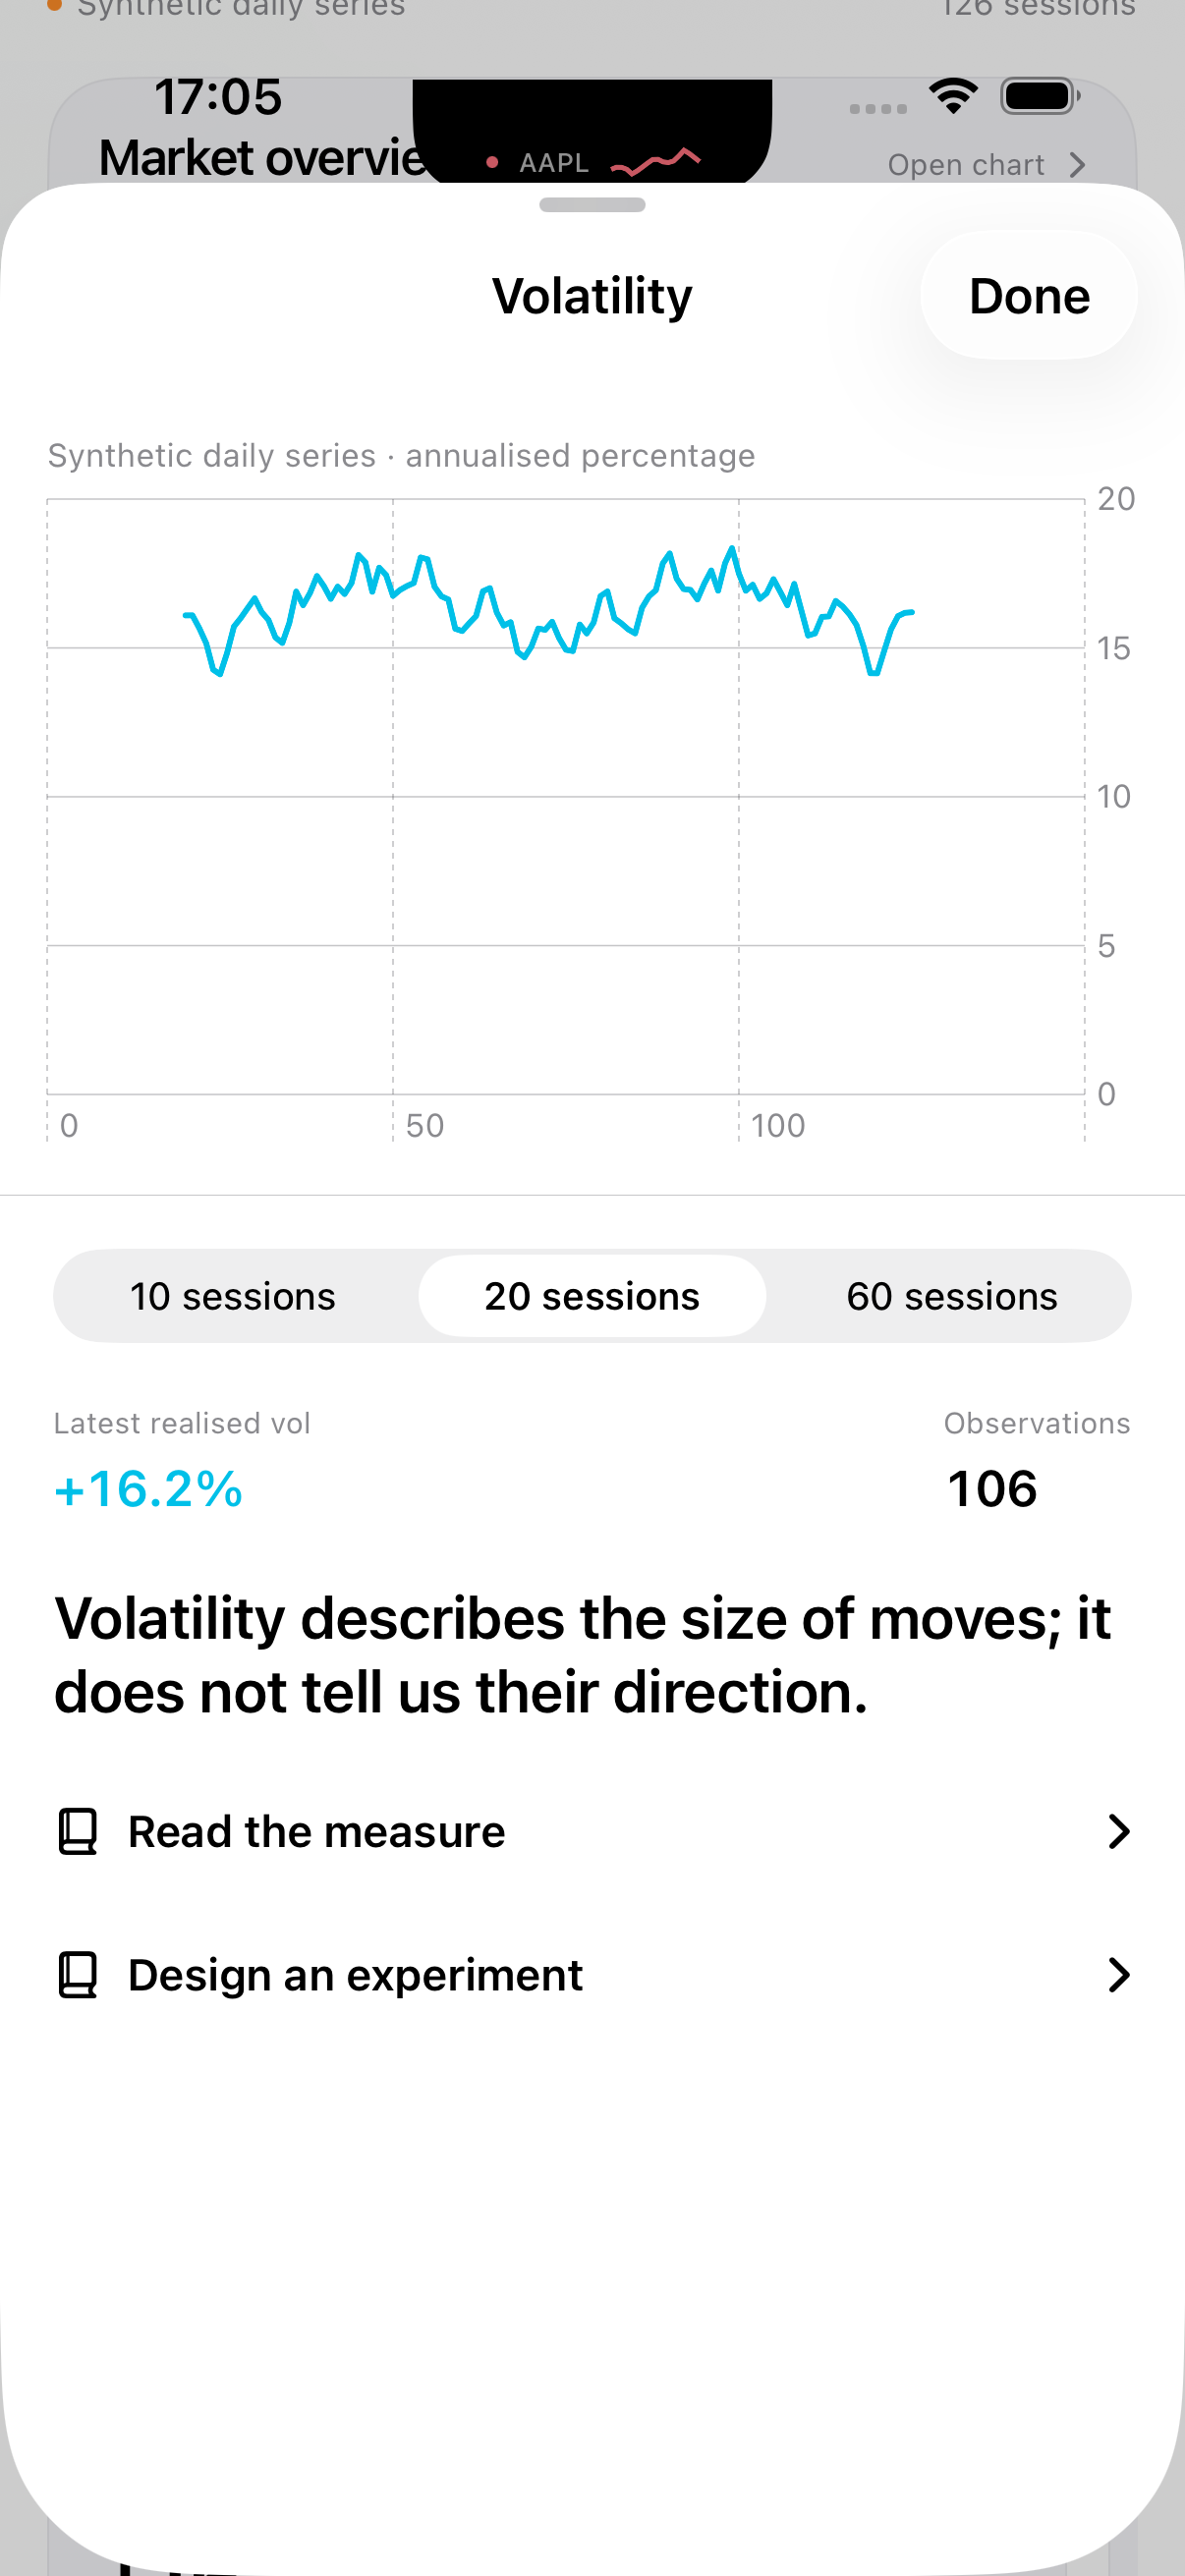
Measure realised variation across rolling windows; examine the distribution beyond a single headline number.
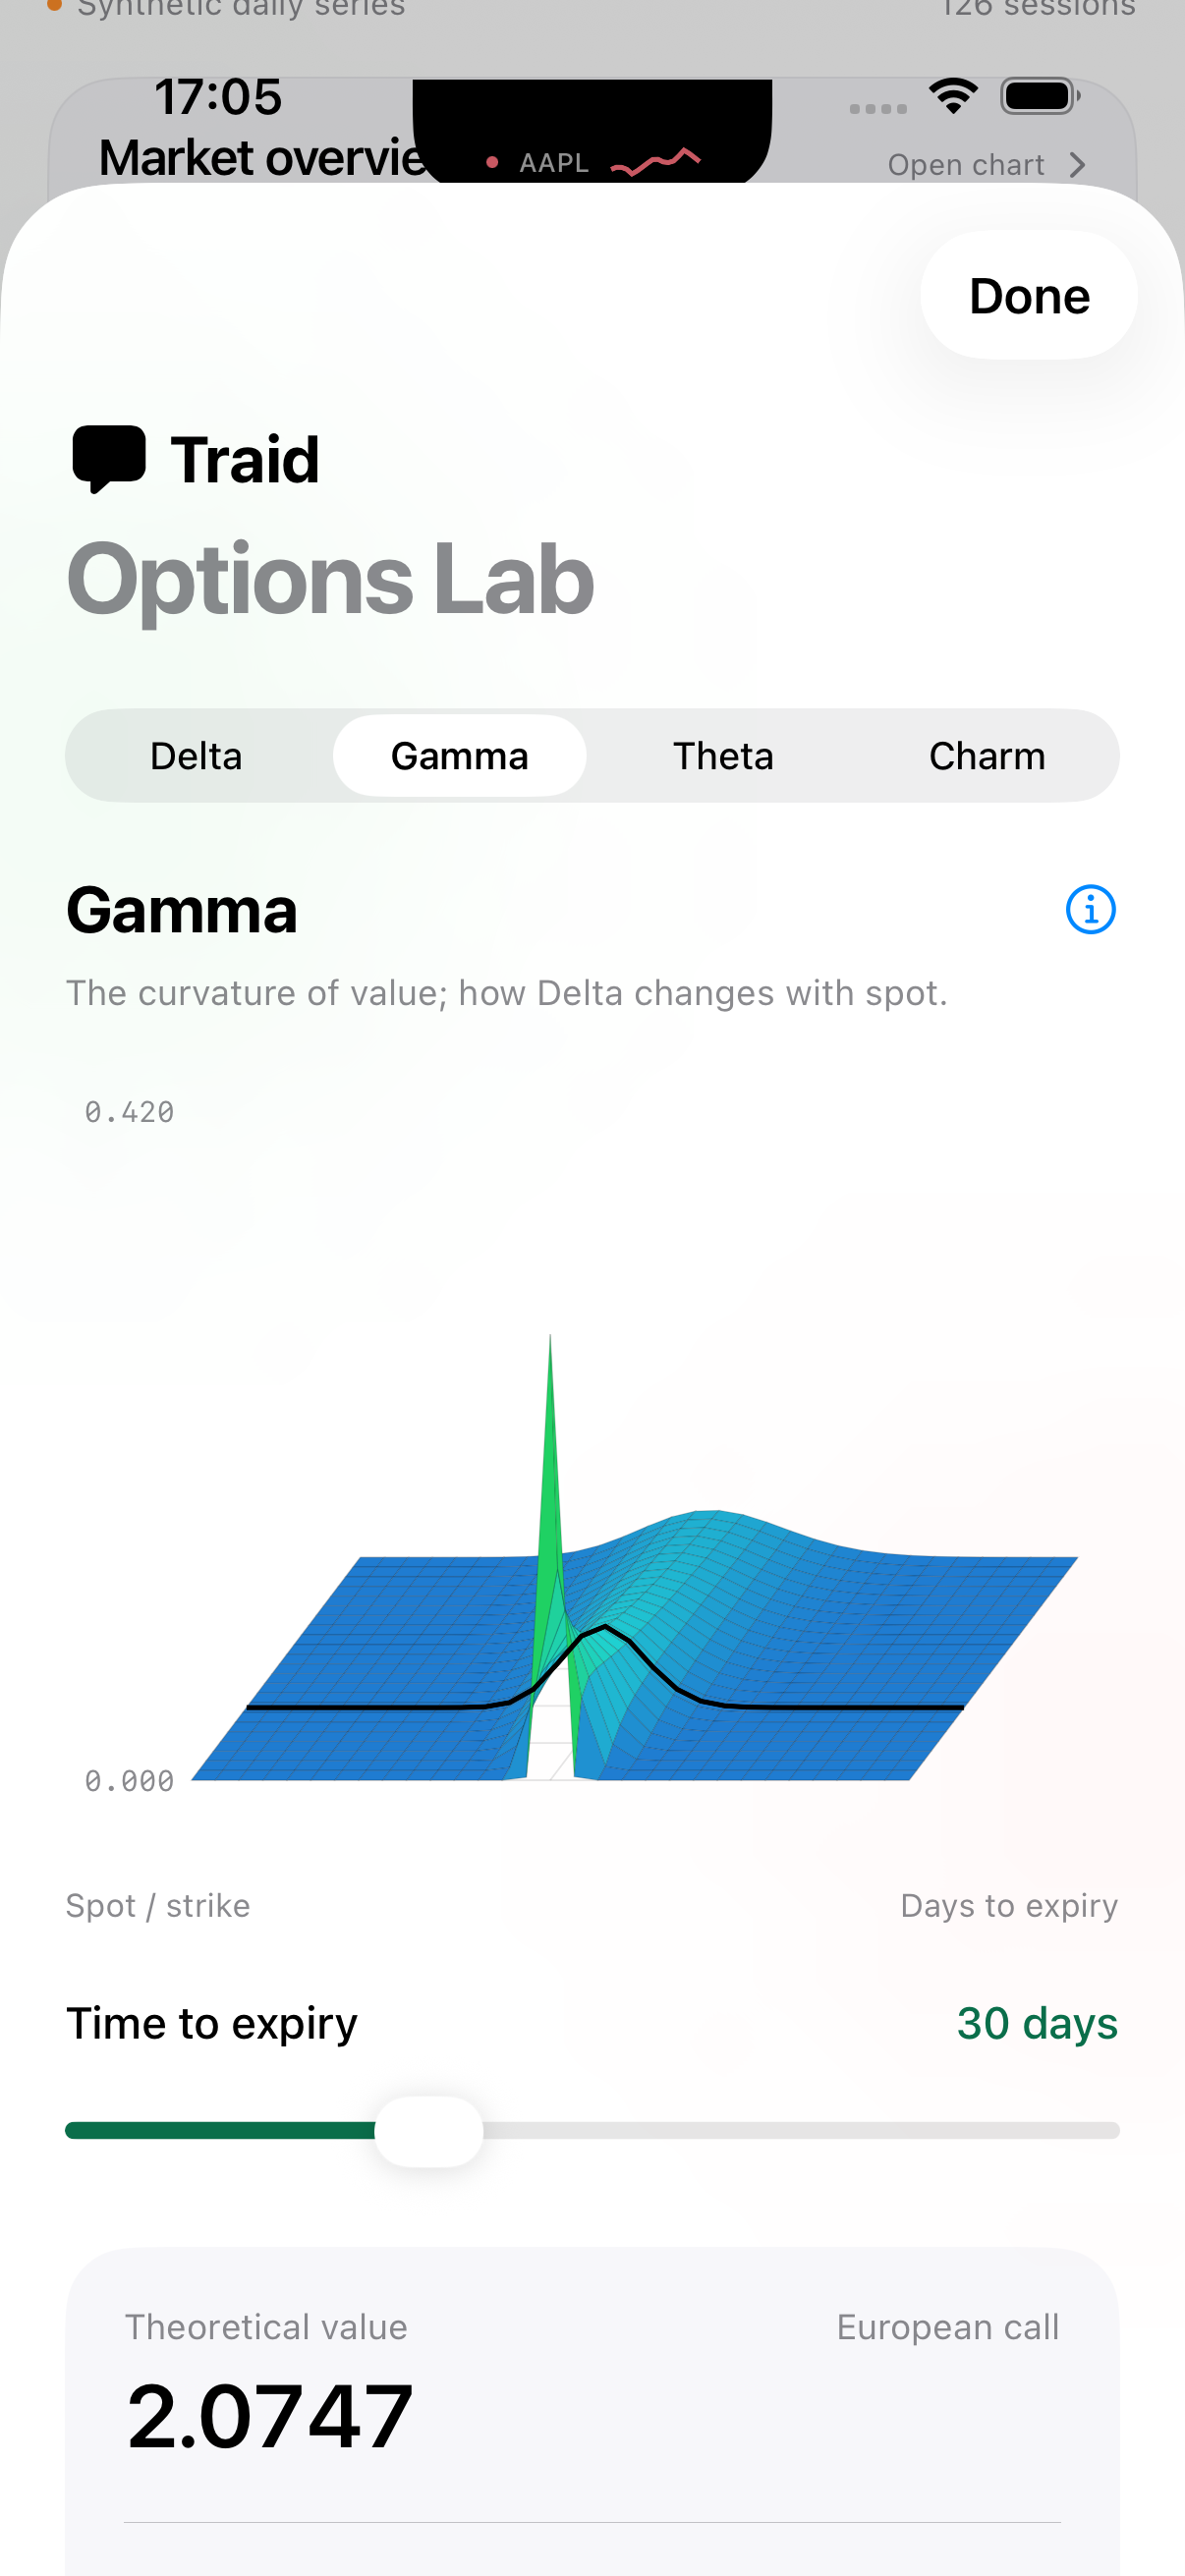
Explore option sensitivities across price and expiry; test how a change in assumptions changes the result.
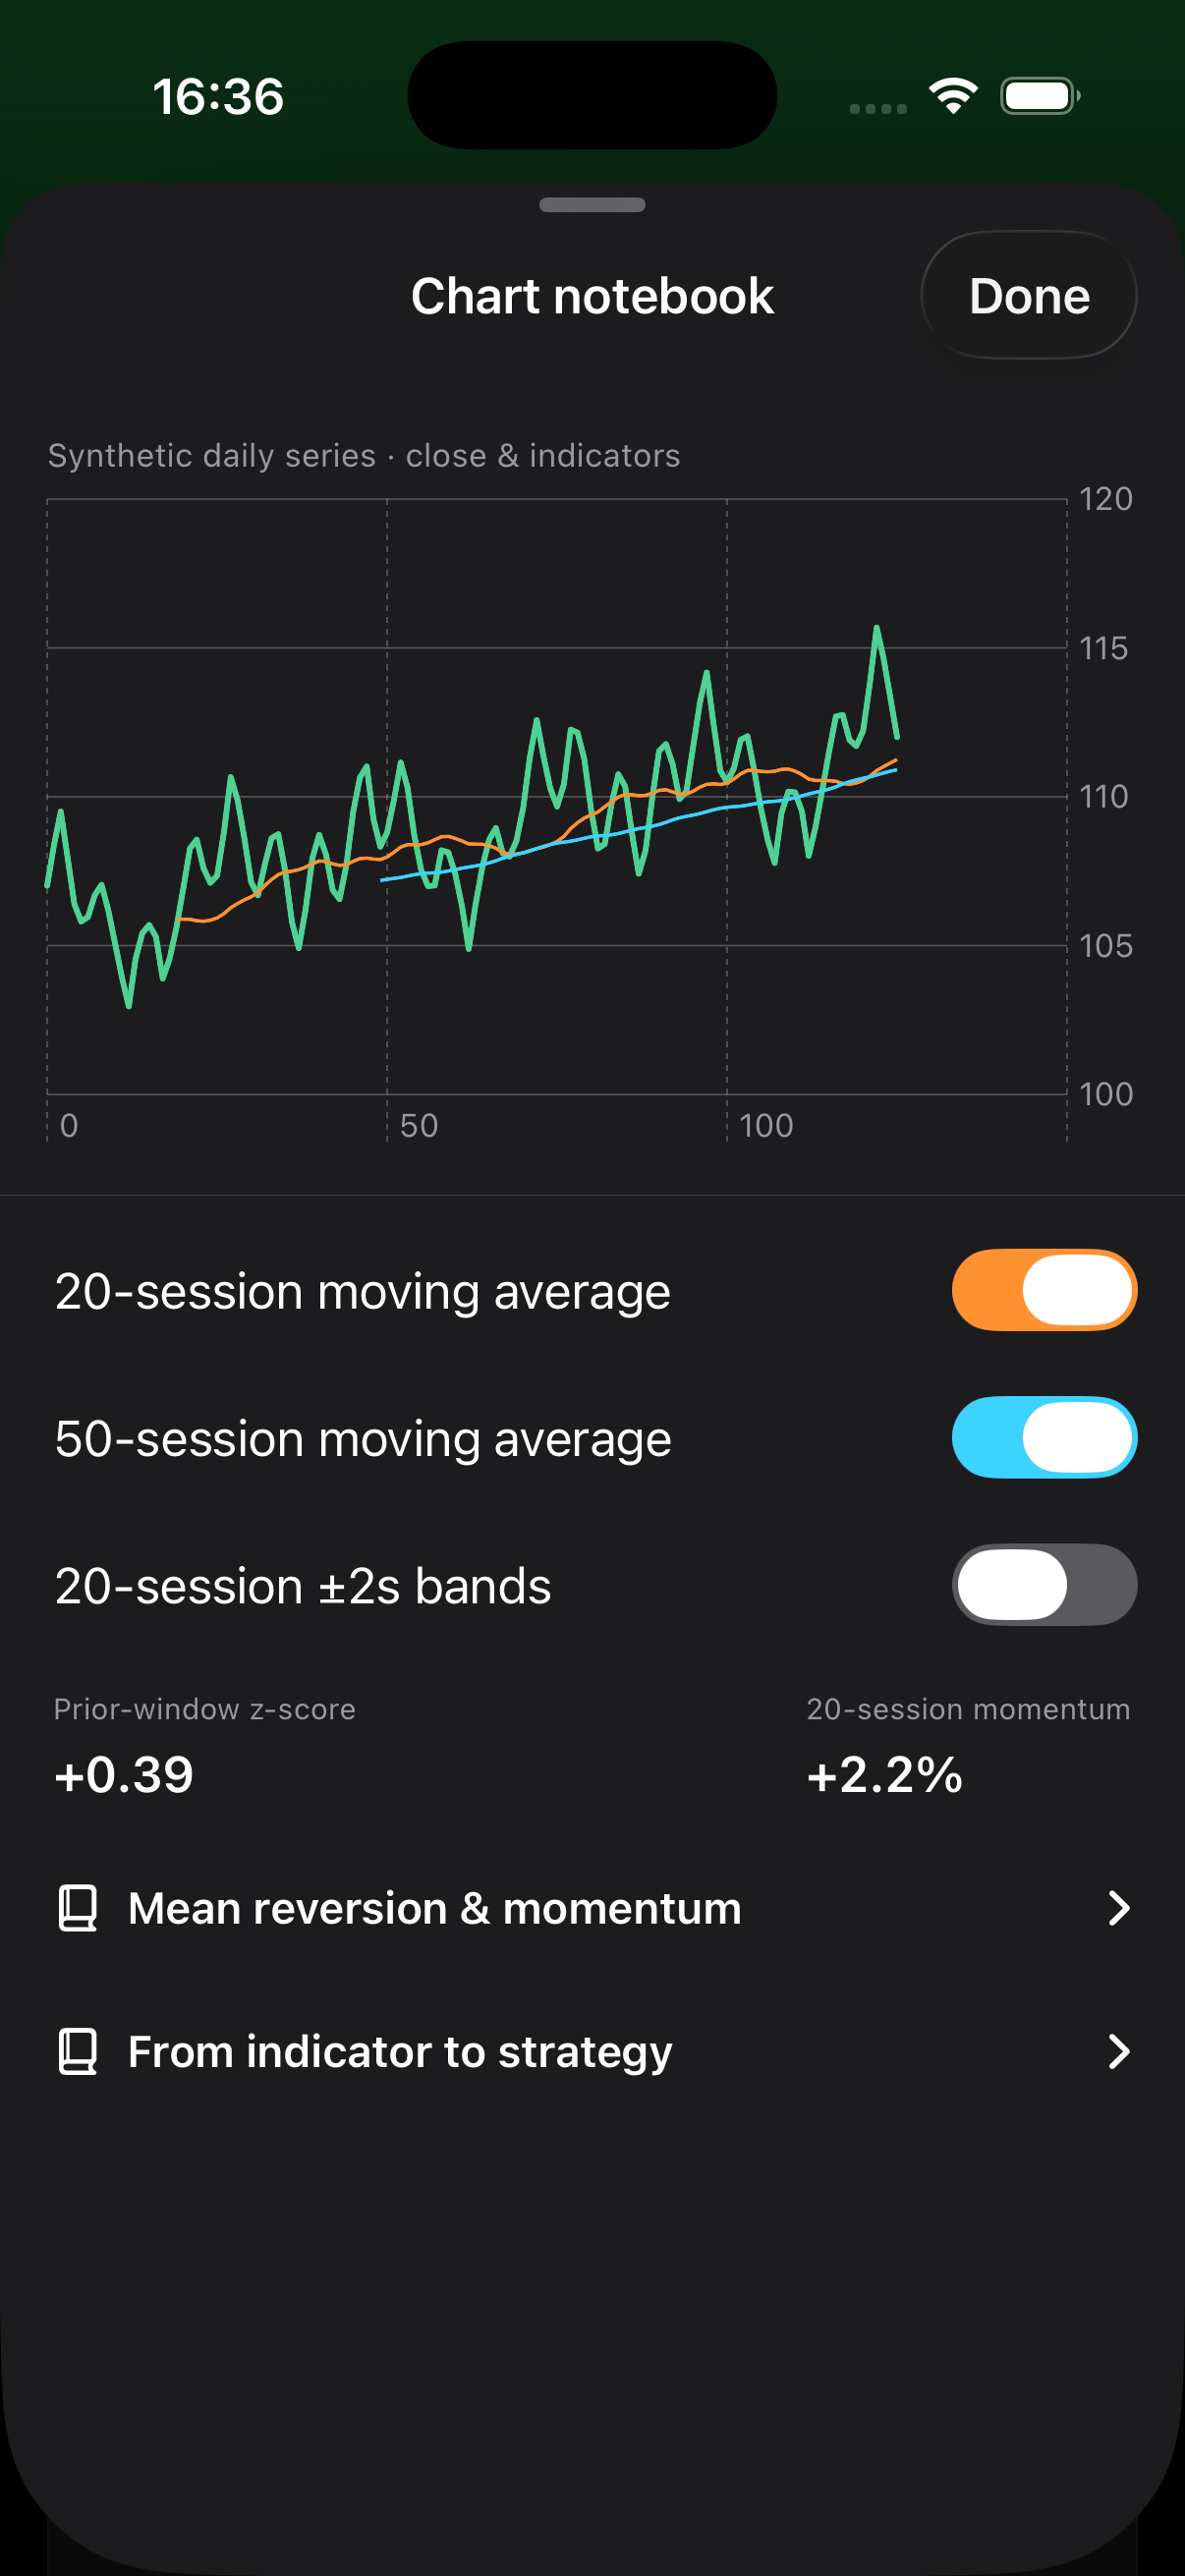
Study trends and deviations with moving averages and price bands; keep the research question in view.
Research charts use labelled synthetic series. Market archives retain observation dates so you can judge the age of the evidence.
Coming soon on the App Store. Cross-device account sync and distribution are in development.

Weigh the bullish, neutral and bearish case. Explore volatility and option sensitivities, with the assumptions behind the numbers always in view.

Deep research at your desk. A focused toolkit on your phone. The planned Terminal tether will connect research handoff and workspace controls; it is still in development.
Explore market structure, model evaluation and the mathematics of prediction; research notes connect each question to its evidence and underlying literature.
We are building a research system that connects events, evidence and outcomes. Each new capability earns its place through work that can be inspected.
Source-linked Global history, daily-data imports, strategy tests and private saved studies. Explore EMA, ATR, RSI, channels and confirmed gaps; inspect returns, drawdowns and execution costs, then replay the calculation.
Explore GlobalA retained history of research attempts, selection-bias measures and leakage checks. Measure how sensitive a result is to the data, the costs and the choices behind it.
Research directionRegistered hypotheses, frozen strategy versions and a prospective ledger. Record signals before outcomes arrive, then follow daily paper results with their data, timing and execution assumptions.
Explore the research approachA research workspace. A pocket quant. A wallet and card.
One connected direction for Traid.
The 3D preview is unavailable in this browser.
A magnetic companion to your iPhone. The planned wallet brings the identity of your research desk into something you can carry.
The planned payment companion to Traid Wallet. A quiet metal finish, a precise mark and a place in the same connected family.
The 3D preview is unavailable in this browser.
Wallet and Card are in development. Launch details for hardware, payments and cross-device connections will follow.
Go to the primary literature. Explore the foundations of option pricing, statistical learning and strategy evaluation; follow the evidence beyond the result.